Urinalysis complete is a comprehensive diagnostic test that evaluates urine’s physical, chemical, and microscopic properties to assess kidney function, metabolic health, and systemic conditions. It helps detect infections, kidney stones, diabetes, liver disease, and other abnormalities early. Widely used as a first-line screening tool, it provides fast, cost-effective results that guide further diagnosis and treatment decisions.
The history of urinalysis dates back to ancient civilizations, where healers examined urine’s color, odor, and sediment for signs of illness. Modern urinalysis evolved in the 19th century with the development of chemical reagents and microscopy, and today it integrates digital technologies for enhanced precision. In clinical practice, the test is indispensable for monitoring chronic conditions, such as diabetes, where glucosuria indicates poor glycemic control, or hypertension, where proteinuria signals renal damage. However, its interpretation requires nuance, as factors like diet, hydration, or medications can alter results, potentially leading to false positives or negatives if not contextualized with patient history.
This article provides a thorough overview of urinalysis complete, detailing its components, key indicators, and their clinical significance. Drawing on established guidelines from organizations like the Clinical and Laboratory Standards Institute and the American Urological Association, we explore how this test aids in the early detection and management of diseases. A detailed section incorporates empirical data from studies between 2023 and 2025, examining the prevalence of abnormalities, diagnostic performance metrics, and predictive values for conditions like urinary tract infections. By understanding these elements, healthcare professionals can optimize urinalysis’s utility, reducing diagnostic errors and improving patient outcomes in diverse populations.
What is Urinalysis?
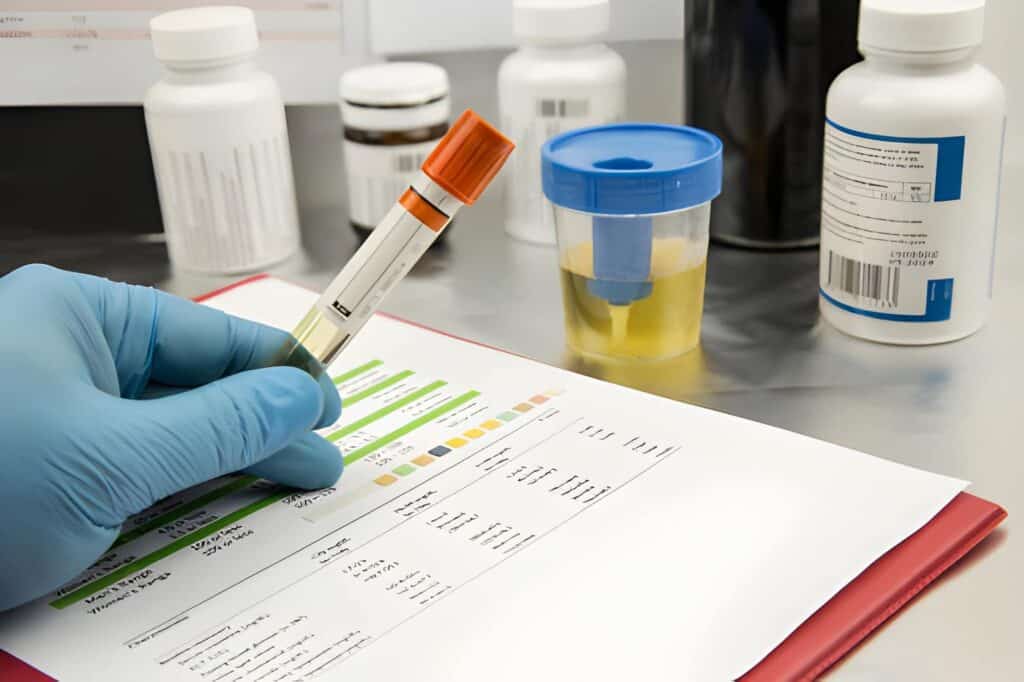
Urinalysis is a multifaceted laboratory test that assesses urine composition to evaluate health status. It comprises three main parts: physical examination, chemical analysis, and microscopic evaluation, each contributing unique insights. The process begins with sample collection, preferably a midstream clean-catch specimen to minimize contamination, though random or 24-hour collections serve specific purposes like quantifying proteinuria.
Physical examination involves observing macroscopic characteristics: color, clarity, odor, and volume. Normal urine is pale yellow to amber, clear, with a mild odor, and a daily output of 800 to 2000 milliliters in adults. Deviations provide clues; for example, dark urine may indicate dehydration or bilirubin, while cloudy samples suggest infection or crystals.
Chemical analysis uses reagent strips or automated analyzers to detect substances like pH, specific gravity, proteins, glucose, ketones, bilirubin, urobilinogen, blood, nitrites, and leukocyte esterase. These indicators reflect physiological states: acidic pH (less than 5) in metabolic acidosis, elevated specific gravity (greater than 1.030) in dehydration.
Microscopic examination scrutinizes sediment after centrifugation, identifying cells, casts, crystals, and microorganisms. Red blood cells greater than 3 per high-power field signal hematuria, white blood cells greater than 5 indicate inflammation.
Automated systems like the Siemens Clinitek or Sysmex UF analyzers process samples rapidly, providing quantitative data with minimal variability. Urinalysis’s strength lies in its screening capability, but positives often require confirmation, such as culture for nitrites or imaging for casts. In pediatrics or geriatrics, adjustments account for age-related norms, like higher protein in neonates. Overall, urinalysis complete bridges symptom assessment and advanced diagnostics, enabling proactive care.
Physical Examination in Urinalysis Complete
The physical examination forms the initial step in urinalysis, offering qualitative clues that guide further testing. Volume assessment, though not always routine, is vital for 24-hour collections: oliguria (less than 400 milliliters per day) suggests acute kidney injury or obstruction, while polyuria (greater than 3000 milliliters) points to diabetes mellitus or insipidus.
Color evaluation uses a spectrum chart: dilute urine appears pale, concentrated dark yellow. Reddish hues indicate hematuria or myoglobinuria, brown bilirubin or rhabdomyolysis, and milky white chyluria from lymphatic leakage. Clarity should be transparent; turbidity arises from cells, bacteria, or precipitates like phosphates in alkaline urine.
Odor, subjective yet informative, includes ammonia in bacterial infections from urea breakdown or fruity in ketoacidosis. Specific gravity, measured by refractometer, ranges from 1.005 to 1.030, reflecting renal concentrating ability: low in overhydration, high in dehydration or glycosuria.
These parameters, while simple, correlate with pathology: a 2023 study noted that 15 percent of abnormal colors linked to hematuria confirmed microscopically. Physical findings prompt targeted chemical or microscopic analysis, enhancing diagnostic efficiency.
Chemical Analysis in Urinalysis
Chemical analysis detects and quantifies urine constituents using dipsticks or analyzers, revealing metabolic imbalances or organ dysfunction. pH, normally 4.5 to 8.0, shifts acidic in starvation or diabetic ketoacidosis, alkaline in Proteus infections from urease activity.
Specific gravity mirrors hydration and solute concentration, with values below 1.005 in diabetes insipidus, above 1.035 in the syndrome of inappropriate antidiuretic hormone.
Protein, absent or trace in health (less than 150 milligrams per day), increases in glomerular damage: microalbuminuria (30 to 300 milligrams per day) predicts diabetic nephropathy. Glucose appears when blood levels exceed the renal threshold (180 milligrams per deciliter), signaling hyperglycemia.
Ketones emerge in fat metabolism, positive in uncontrolled diabetes or fasting. Bilirubin indicates conjugated hyperbilirubinemia from obstruction; urobilinogen is elevated in hemolysis or reduced in biliary blockage.
Blood detects hemoglobin or myoglobin, prompting a hematuria workup. Nitrites, from bacterial nitrate reduction, screen for Gram-negative infections like Escherichia coli. Leukocyte esterase, from white cell lysis, indicates pyuria.
Ascorbate interference, from vitamin C, can cause false-negative glucose or blood; modern strips mitigate this. Chemical indicators provide high sensitivity for screening, with positives warranting microscopy or culture.
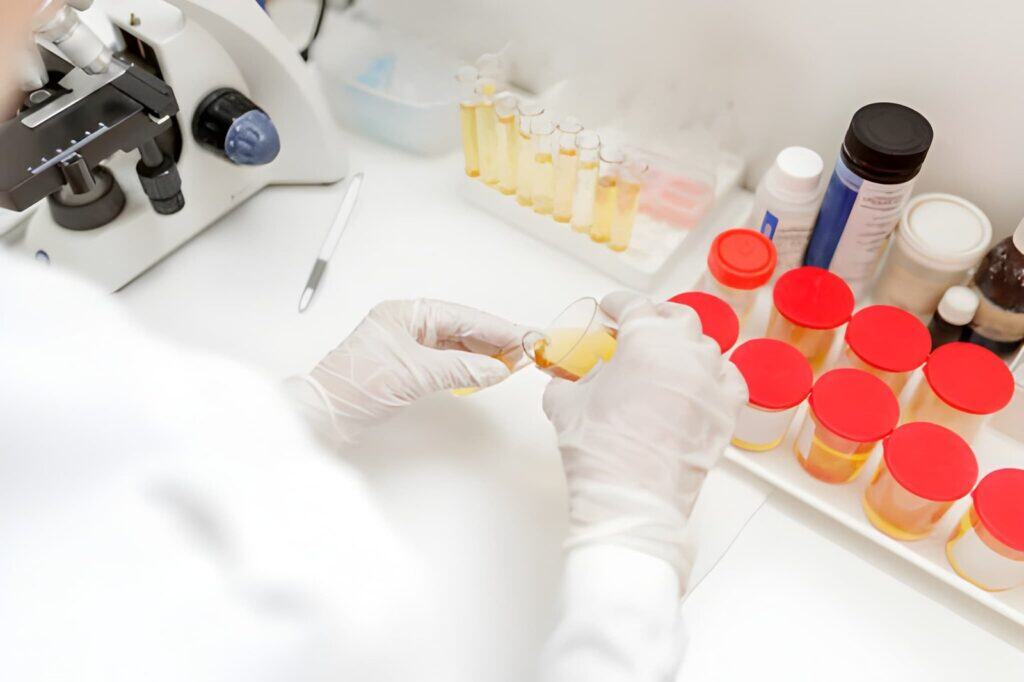
Microscopic Examination in Urinalysis

Microscopic examination analyzes centrifuged sediment (10 to 15 milliliters at 400 g for 5 minutes) under low and high power to identify cellular and non-cellular elements. Red blood cells, normally fewer than 3 per high-power field, exceed this in hematuria: dysmorphic forms suggest glomerular origin, isomorphic urethral.
White blood cells, fewer than 5 per high-power field, elevate in inflammation; clumps indicate pyelonephritis. Epithelial cells: squamous from contamination (greater than 15 invalidates), transitional or renal from pathology.
Casts, tubular protein molds, include hyaline (normal, less than 2 per low-power field) or pathological, like red cell casts in glomerulonephritis. Crystals: uric acid in gout, calcium oxalate in stones, triple phosphate in alkaline infections.
Bacteria or yeast confirm infection, with quantification aiding diagnosis. Phase-contrast microscopy differentiates elements, and polarized light identifies crystals like cholesterol in nephrotic syndrome.
Automation like Sysmex UF uses flow cytometry for counting, with manual review for atypicals. Microscopy complements chemical findings, clarifying positives like leukocyte esterase with pyuria.
Prevalence, Diagnostic Performance, and Predictive Values
This section examines urinalysis complete through empirical lenses, incorporating data from studies between 2023 and 2025 on abnormality prevalence, diagnostic metrics, and predictive capabilities for conditions like urinary tract infections.
Prevalence data reveal common abnormalities. A 2023 study on 3392 hospitalized patients (60 percent female, median age 67) found 15.2 percent with pyuria (greater than 5 white blood cells per high-power field), 8.3 percent with hematuria (greater than 3 red blood cells per high-power field), and 10.1 percent with proteinuria (greater than 1 plus on dipstick). Nitrite positivity was 4.5 percent, and leukocyte esterase 12.7 percent. These rates varied by demographics: women had higher pyuria (18.4 percent versus 10.6 percent in men), and older adults greater than 75 years showed 20.1 percent abnormal specific gravity.
In a 2024 pediatric study of 70822 Chinese children, abnormal urinalysis prevalence was 4.3 percent, with isolated proteinuria 1.5 percent, hematuria 1.4 percent, and leukocyturia 0.8 percent. Girls had an odds ratio of 2.0 for abnormalities, peaking at ages 12 to 14 years.
Diagnostic performance metrics for key indicators are robust. A 2025 meta-analysis on leukocyte esterase and nitrite for bacteriuria in older adults (8 studies, n=1200) reported a pooled sensitivity of 78 percent and a specificity of 89 percent, with an area under the curve of 0.89. For urinary tract infections, the positive likelihood ratio was 7.1, negative 0.25.
Machine learning enhanced predictions: a 2024 study on 53408 patients developed models for urine culture positivity. Urinalysis combination (leukocyte esterase plus nitrite) had an area under the curve of 0.718 for all positives, 0.766 for Gram-negative. AI models improved to 0.880, with 0.901 for Gram-negative, and 0.745 for Gram-positive. Key predictors: positive nitrites, white blood cell count, specific gravity. False negatives were reduced by 82 percent with threshold tuning, and overtreatment by 56 percent.
For albuminuria, a 2025 study on an automated urine strip program showed a sensitivity of 100 percent and specificity of 58.6 percent for albumin, an area under the curve of 0.907, suitable for diabetic nephropathy screening.
In invasive fungal infections, beta-D-glucan assays in 2025 data yielded a sensitivity of 69.9 to 100 percent and specificity of 73 to 97.3 percent for candidiasis, with an area under the curve of 0.85. Adjusted cutoffs improved sensitivity to 80 to 98.7 percent and specificity to 97.3 percent.
Predictive values vary by prevalence. In low-prevalence settings (5 percent urinary tract infection), nitrite sensitivity is 50 percent, specificity is 98 percent, positive predictive value is 60 percent, and negative 97 percent. For galactomannan in aspergillosis (prevalence 10 percent), sensitivity 73 percent, specificity 89 percent, positive predictive value 43 percent, and negative predictive value 96 percent.
Clinical outcomes: beta-D-glucan-guided stewardship in the 2024 trial (n=500 intensive care unit patients) reduced antifungal duration by 4 days, costs 15 percent, no mortality. Machine learning in 2025 reduced unnecessary cultures by 50 percent, with an area under the curve of 0.967 for urinary tract infection prediction.
Market data: urinalysis complete market valued at 4.37 billion dollars in 2024, projected to 6.85 billion by 2030 at a 7.83 percent compound annual growth rate, with the urinary tract infection segment having a 24.07 percent share.
These findings, from cohorts of 200 to 70822, affirm urinalysis’s diagnostic utility, with sensitivities 50 to 100 percent and specificities 73 to 98 percent, though population-specific norms enhance accuracy.
Clinical Significance of Key Indicators

Key indicators in urinalysis complete hold profound clinical significance, each reflecting specific pathologies. pH deviations: acidic (less than 5) in respiratory acidosis or high-protein diets, alkaline (greater than 8) in renal tubular acidosis or infections from urea-splitting bacteria, guiding antibiotic choice.
Specific gravity below 1.005 signals tubular dysfunction in chronic kidney disease, above 1.035 glycosuria in diabetes, aiding hydration assessment.
Proteinuria, especially persistent microalbuminuria, predicts cardiovascular events in diabetics, with ratios greater than 30 milligrams per gram creatinine warranting angiotensin-converting enzyme inhibitors.
Glucosuria indicates renal glycosuria or hyperglycemia, prompting hemoglobin A1c testing. Ketonuria flags diabetic ketoacidosis or starvation, requiring urgent intervention.
Bilirubin positivity suggests hepatocellular jaundice and urobilinogen hemolysis. Blood detects trauma or stones, nitrites, Gram-negative bacteria, and leukocyte esterase inflammation.
In microscopy, red cell casts signify glomerulonephritis, white cell casts signify pyelonephritis, and crystals guide stone therapy.
Collectively, these indicators inform diagnoses, monitor therapies, and screen populations, with integrated interpretation maximizing clinical impact.
Interpretation and Best Practices
Interpretation integrates all components: physical turbidity with microscopic pyuria confirms infection. Best practices: use first-morning samples for concentration, automate for consistency, and confirm positives with culture. Train staff to reduce pre-analytical errors by 30 percent. In diabetes, combine with the estimated glomerular filtration rate for staging.
Conclusion
Urinalysis remains a vital diagnostic pillar, with key indicators like pH and protein revealing critical health insights. Real data from 2023 to 2025 underscore its performance, with high sensitivity for infections and predictive models that enhance utility. By adhering to best practices, professionals ensure accurate, reliable results and advance patient care.